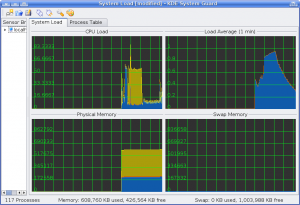
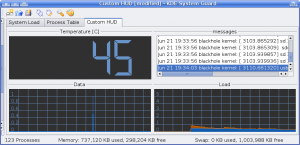
The KDE System Guard at first glance just looks like a simple system monitor application which lets you take a look at the System Load and Processes running on your machine.
It is actually capable of a lot more monitoring than that, and if you delve deeper into it, you can customise the way it works to show you information about your system that you are interested in.
So, let's take a look at the program. You should find it under the System category of your Applications list (it might be named Performance Monitor).
What you have is two tabs, as I mentioned, that give you some statistics about how hard your machine is working, and the processes running on it. Along the left hand side, there's also a Sensor Browser pane. If you want, you can take a look through the available sensors to see what you can look at.
So, let's create a new tab within KSysGuard to show some additional information.
The application calls these tabs 'worksheets', and you can make a new one and drop your desired sensors onto it, to make a heads-up display for the statistical information you care about.
For this example, I'm going to create a worksheet to show me the current CPU temperature, the content of /var/log/messages (so I can see what hardware gets attached for example, or any other messages from the kernel), a network measure and my 15-minute load averages. Of course, here, you'll probably want to pick a set of sensors that you are interested in watching, these are just examples.
So first we need to make a new worksheet to put these on. Go to File and choose New Worksheet.
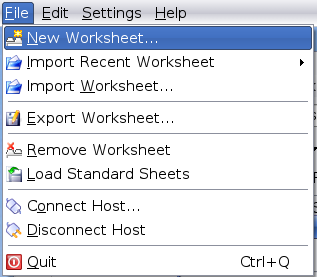
Give it a name, I'll go for Custom HUD. You also set here the number of rows and columns that this worksheet provides you. Because I have four sensors I want on this sheet, I obviously need two columns and two rows.
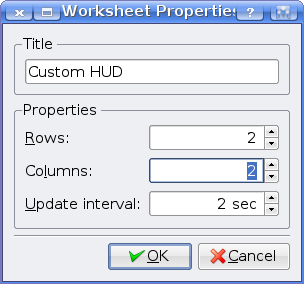
You can also set here how frequently the data is kept updated. More frequently will mean that your monitoring will be more expensive in terms of CPU usage and will mean KSysGuard will consume more resource. I'm going to leave the default here.
Once that's done, you'll have a blank tab, or worksheet, to work with. There should be four 'Drop sensor here' labels.
Simply drag and drop sensors from the browser into these cells. Some sensors have more than one way of showing you the data, such as a graph, or just a number. When you drop them, you'll be asked which type of display to use.
Once you've got everything in place, you can now monitor what's going on. Be sure to right-click your sensors and check the Properties. Some sensors allow you to change the way they report things, so it's worth checking those settings to see if there's anything you can tweak to get it to work the way you want.
In addition, if you picked a graph view, you can often manually configure the maximum and minimum points of the graph if you want, instead of auto-detecting the max and min from the values it gets.
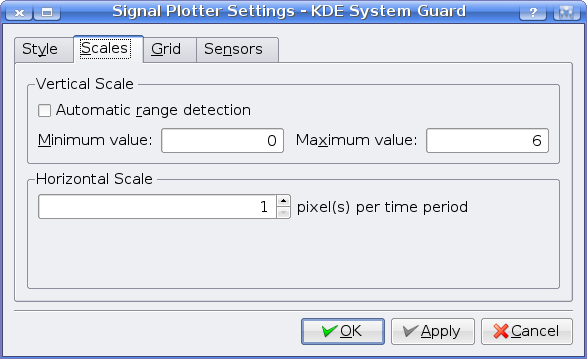
Another point I should make is that if you do pick a Bar Graph style display, it is possible to then drag additional sensors onto the same graph, and plot two different sets of values for comparison. Once you've dropped them on, configure the Graph by right-clicking, and going to Sensors in Properties.
When you're happy with your layout, click the Export Worksheet button (or choose it from File). If you save into the default folder it gives you (~/.kde/share/apps/ksysguard/), it will open back up automatically next time you launch KSysGuard.
And there you have it. You can now view your favourite statistics about the running of your machine from KSysGuard. What looks on the surface like a pretty basic monitoring application is actually a lot more powerful, and gives you quite a bit of flexibility. Granted, watching statistics about how your machine is running might not be the most exciting thing in the world, but if you're semi-obsessed (like me, perhaps?) or trying to troubleshoot, KSysGuard can be pretty useful.
A quick footnote for those interested - the exact locations of the sensors I used for my custom HUD are as follows:
- ACPI > Thermal Zone > THRM > Temperature
- logfiles > messages
- Network > Interfaces > eth0 > Receiver > Data
- CPU Load > Load Averages (15 mins)
